by Nick Barlow
Colorado’s snowpack received much-needed help during January and February, including the first significant winter storms in the Southern Mountains. As we eye our next period of active weather ahead, we have an opportunity to place this year’s snowpack into its historical context.
Below, you’ll find recent data from the NRCS SNOTEL network. Data from these automated mountain weather stations shed light on the current condition of our snowpack. It’s been a difficult winter so far for snow lovers, but how bad is it really?
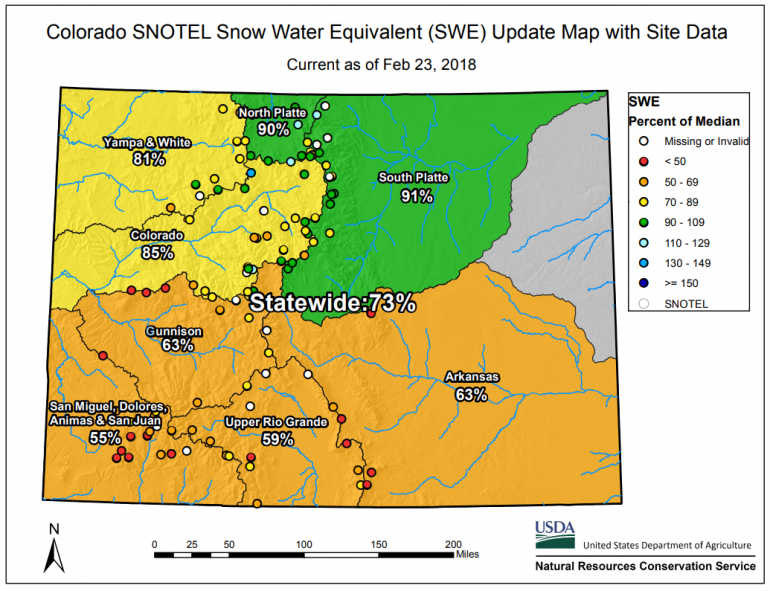
Winter storms since January 1st increased the statewide snow water equivalent (SWE) by about 19 percent vs. the historical median. The Southern Mountains realized the greatest gains during this period. The Wolf Creek Pass SNOTEL station measured 13.3 inches SWE since January 1st, which is 146% of the historical median for this period. However, the statewide seasonal numbers remain disappointing. The map above displays a general north-to-south gradient in snowpack deficit, with most stations in the Southern Mountains reporting less than 60 percent median SWE to date. Deficits are less in the Northern Mountains, where a few sites have SWE numbers near or even above the historical median. SNOTEL data in the Central Mountains varies significantly, with generally-better numbers observed east of Aspen and Crested Butte.
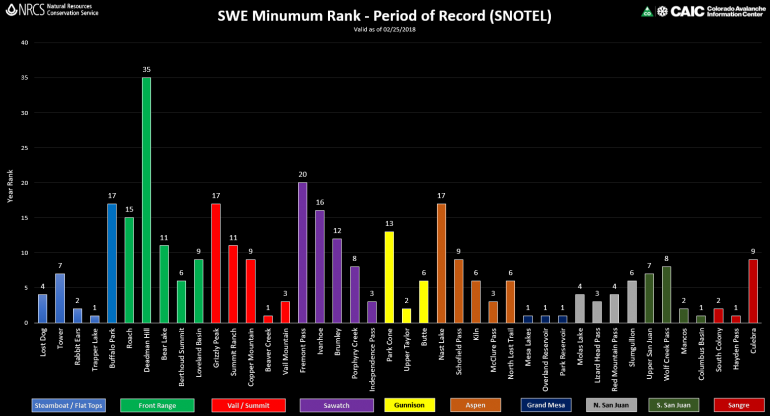
The chart above ranks this year’s SWE to date vs. all past years on record. The number indicates how many years had less accumulated SWE on the same date, so 1 indicates the driest year on record. The dataset is not standardized, as the period of record varies by station. Despite frequent winter storms since January 1st, some SNOTEL sites remain at their lowest SWE levels to date on record. Current ranks are generally better at selected sites in the Front Range, Vail & Summit County, and Sawatch zones. Notably, the current water year ranks seventh wettest at both the Buffalo Park (south of Rabbit Ears Pass) and Deadman Hill (west of Red Feather Lakes) SNOTEL stations. Hard to believe?
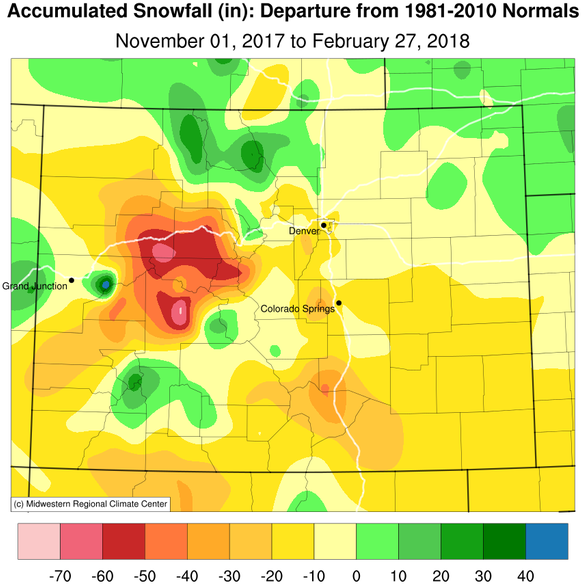
These products display snow water equivalent on the ground as of February 25th, but how does observed precipitation since November compare historically?
Accumulated snowfall since November 1st is at or above the 30-year average in portions of the Park Range, Northern Front Range, Sawatch, and San Juan mountains. Significant snowfall deficits exist west of Vail Pass, extending throughout the Aspen and Gunnison zones. Local variability certainly exists beyond the resolution of this product. Regardless, these numbers may appear surprising, unless we consider this winter’s pattern of storm frequency.
The current water year (October 1, 2017 – September 30, 2018) began with above-average mountain snowfall in portions of Colorado. Appreciable winter storms arrived during the beginning and middle portions of November, and also during the end of December and early January. Most recently, measured snowfall in February 2018 is above average for much of Colorado. The result is above-average snowfall this winter for some areas, but storms were too few and far between for the snowpack to develop accordingly. In other words, the storm snow sat idly for weeks at a time, while precious SWE sublimated or melted away. The redistribution of snow on the ground via frequent wind events could have also played a role.
On average, the statewide SNOTEL network realizes peak SWE numbers by April 9th. This means we have around one and half months remaining to make up ground on the historical numbers. Can we recover from the historically-dry fall and early winter period?
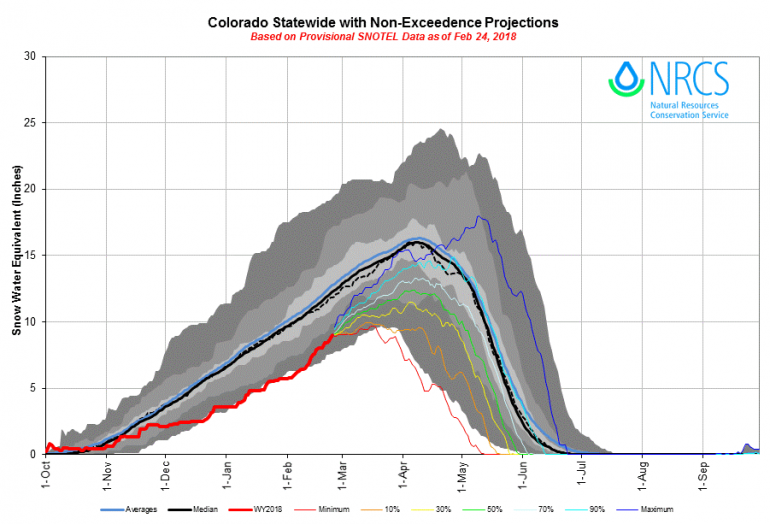
The chart above displays non-exceedance projections for our current water year. The heavy red line shows the observed statewide SWE as of February 24th, 2018. The thin colored lines (blue through red) indicate the range of possible futures. Blue-tinted lines indicate generally wetter scenarios, while red-tinted lines indicate drier scenarios. Here you can see the minimum, maximum, 10, 30, 50, 70, 90 percent non-exceedance scenarios. For example, the 90 percent exceedance line represents the boundary in the historical record in which 90 percent of the time any day’s SWE value will be below this value.
Only under the maximum and 90 percent statistical scenarios do we approach or exceed average statewide SWE before the spring runoff. While not impossible, both scenarios have a low probability of occurrence. The green line is the most-likely statistical outcome based on historical SNOTEL data. There is a 50 percent chance we end up either above or below any point on the green line. You can see we only have an outside chance of our snowpack recovering to long-term median values.
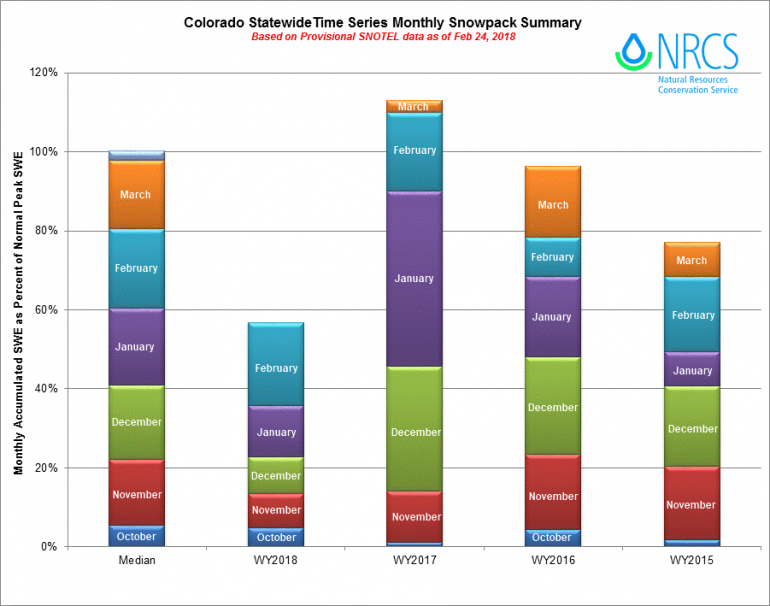
This chart breaks down peak seasonal SWE by month, displaying the current water year, past three water years, and 30-year median. With February nearly finished, Colorado’s snowpack is about 57 percent of the median peak. With our snowiest months already in the bank, median SWE in the mountains come April is an increasingly-unlikely scenario. Unlikely, but not impossible. Every water year has its own unique pattern, and yearly data rarely follows the historical curve. Intra-seasonal variability is common in Colorado, as our snowfall can arrive at different periods of the water year.
Unfortunately, low snowpack levels have consequences well beyond winter recreation. State commerce and tourism can suffer significantly during and directly following a dry winter. We also depend on a healthy snowpack for water supply and agriculture during the drier months. Finally, wildland fire danger can increase significantly following dry winters.
We all want more powder to play in, but there is much more at stake in the crucial weeks ahead. Winter snowfall is the lifeblood for continental climates like ours.

